
Understanding Technical Analysis: A Foundation for Informed Trading

Share market Technical analysis is a powerful method for assessing securities and predicting future price movements based on historical market data. Unlike fundamental analysis, which evaluates a company’s financial statements and industry position, technical analysis focuses on patterns in stock prices, volumes, and other key indicators. By using various tools and techniques, traders aim to uncover trends, forecast price changes, and make informed trading decisions in the share market.
The Basics of Price Charts and Chart Patterns
Price charts are the cornerstone of technical analysis. Traders commonly use different chart types, such as line charts, bar charts, and candlestick charts, to visualize price movements and identify potential trading opportunities.
Types of Price Charts
- Line Chart: Plots the closing prices of a stock over time, creating a simple line.
- Bar Chart: Shows the opening, closing, high, and low prices for a specific period.
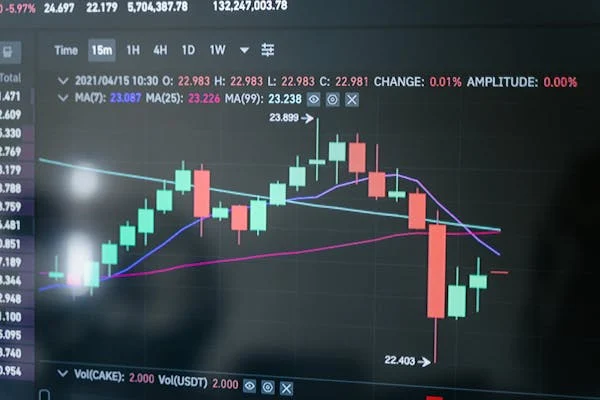
- Candlestick Chart: Represents the same data as a bar chart but in a more visually intuitive format, showing clear up and down movements.
Key Chart Patterns
- Head and Shoulders: Indicates a potential reversal of an uptrend.
- Double Top and Double Bottom: Suggests an impending reversal in either an uptrend or downtrend.
- Triangles (Ascending, Descending, Symmetrical): Point to continuation patterns within an existing trend.
The Role of Indicators in Technical Analysis
Indicators are mathematical calculations based on price, volume, or open interest, helping traders forecast future price movement. Here are some widely used indicators:
Moving Averages (MA)
Moving averages smooth out price data to identify trends over a certain period. There are two primary types:
- Simple Moving Average (SMA): An average of prices over a specific timeframe.
- Exponential Moving Average (EMA): Places more weight on recent prices for a more responsive signal.
Relative Strength Index (RSI)
RSI measures the magnitude of recent price changes to evaluate overbought or oversold conditions. Values range from 0 to 100, with levels above 70 considered overbought and below 30 considered oversold.
Moving Average Convergence Divergence (MACD)
MACD is a momentum indicator that follows trends. It is derived from the difference between two moving averages, often the 12-day and 26-day EMAs. A signal line (9-day EMA of MACD) helps identify buy and sell signals.
Volume Analysis: A Critical Tool for Market Insight
Volume analysis provides insights into the strength or weakness of a price movement. High volume during a price increase suggests strong buyer interest, while low volume indicates a lack of conviction. Conversely, decreasing volume on a rally may suggest the trend lacks sustainability.
Key Volume Indicators
- On-Balance Volume (OBV): Tracks cumulative buying and selling pressure by adding volume on up days and subtracting on down days.
- Volume Price Trend (VPT): A momentum indicator that combines volume with price changes.
Trendlines and Support/Resistance Levels
Trendlines, support, and resistance levels are essential components of technical analysis. They help traders understand the price boundaries and predict potential breakout points.
How to Use Trendlines
Trendlines are drawn to connect successive lows in an uptrend or highs in a downtrend. They act as dynamic support or resistance levels, indicating that prices may revert upon approaching these lines.
Support and Resistance
- Support: A price level where buying interest is strong enough to prevent further decline.
- Resistance: A level where selling pressure may limit further price increase.

Using Technical Analysis for Different Trading Strategies
Day Trading
Day traders leverage short-term indicators such as RSI and MACD to make quick buy and sell decisions, focusing on intraday price movements.
Swing Trading
Swing traders aim to capture price swings over days or weeks. They often use chart patterns, support/resistance, and moving averages to time entries and exits within a broader trend.
Position Trading
Position traders hold trades for months or even years, using weekly and monthly charts to analyze long-term trends and determine entry points.
Risk Management in share market technical analysis
Risk management is critical in technical trading to protect against potential losses.
Setting Stop-Loss and Take-Profit Levels
- Stop-Loss: A predetermined price level where a trade automatically closes to limit loss.
- Take-Profit: An order that locks in gains once the price reaches a target level.
Risk-Reward Ratio
A favorable risk-reward ratio (e.g., 1:3) means a trader risks a smaller amount of capital to achieve a potentially larger gain.
Developing a Share market Technical Analysis-Based Trading Plan
A solid trading plan incorporating technical analysis is essential for consistent success in the share market.
Steps to Create a Trading Plan
- Define Trading Goals: Clarify whether you’re trading for income, capital growth, or risk management.
- Select Indicators and Tools: Choose appropriate indicators based on your trading style.
- Set Entry and Exit Criteria: Establish criteria for opening and closing trades.
- Implement Risk Management Rules: Include stop-loss levels and other safeguards.
By following these strategies and staying disciplined, traders can leverage technical analysis effectively to navigate the complexities of the share market and achieve profitable outcomes.
FAQs on Share Market Technical Analysis
What is the purpose of technical analysis in the share market?
Technical analysis helps predict future price movements based on historical data.
How reliable is technical analysis?
While not foolproof, it can be a valuable tool, especially for short-term trading.
What are the primary tools used in technical analysis?
Key tools include moving averages, RSI, and MACD.
How does technical analysis differ from fundamental analysis?
Technical analysis focuses on price data, while fundamental analysis evaluates a company’s intrinsic value.
Can technical analysis be used for long-term investments?
It is generally more useful for short-term trading, though some patterns apply to long-term.
Is it necessary to use technical indicators for trading?
Indicators enhance decision-making, though some traders rely solely on price action.